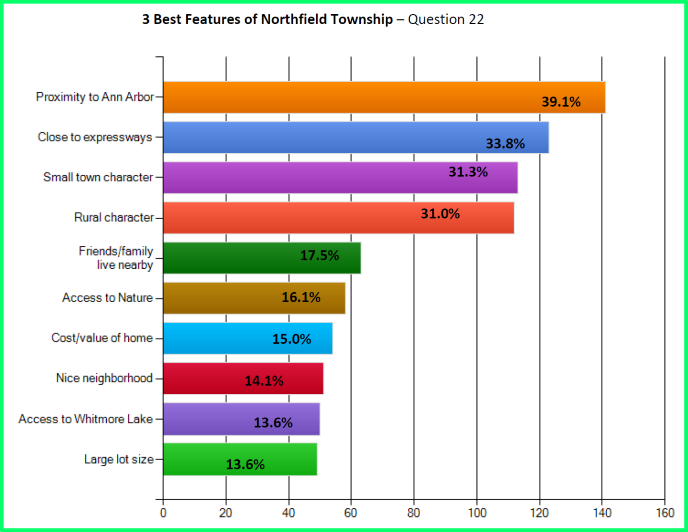
Chart: page 9 Data: page 53-54 of 101 page report
- The 2010 Northfield Township Community Survey Report, 62 page version
- The 2010 Northfield Township Community Survey Report, 101 page version
- The 1996 Northfield Township Community Survey Report

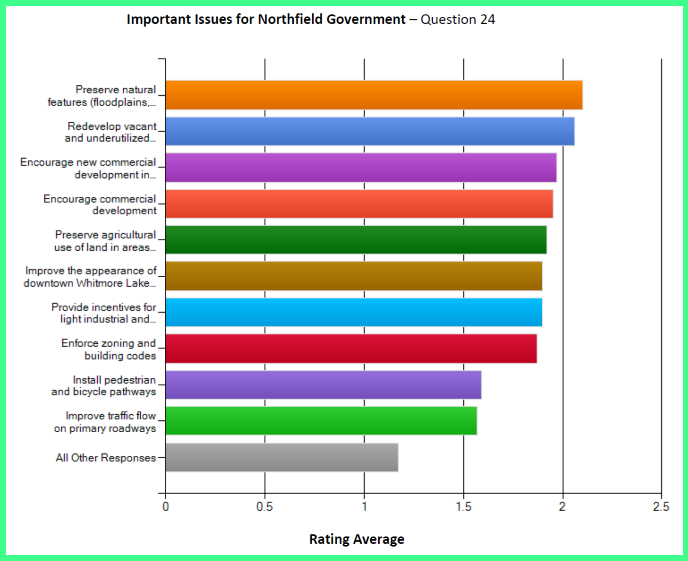
Chart: page 11 Data: page 57-58 of 101 page report

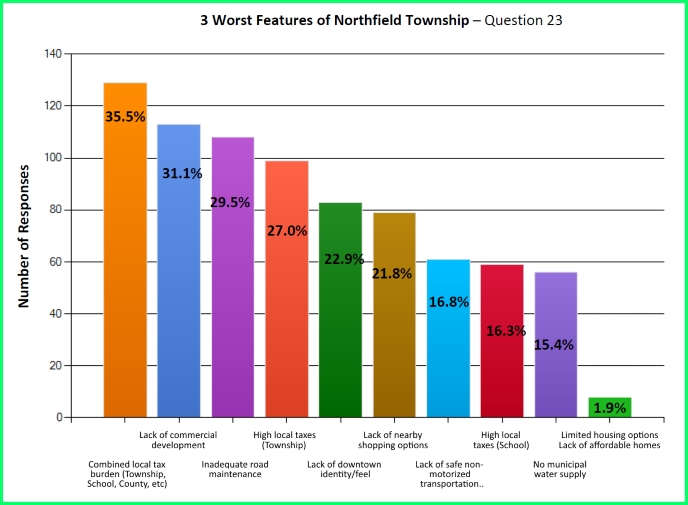
Chart: page 10 Data: page 55-56 of 101 page report
|
2010 Northfield Township Survey |
|||
|
23. What are the 3 worst features of Northfield Township? |
% |
Responses |
|
|
1 |
Combined local tax burden |
35.50 |
129 |
|
2 |
Lack of commercial development |
31.10 |
113 |
|
3 |
Inadequate road maintenance |
29.50 |
107 |
|
4 |
High local taxes (township) |
27.00 |
98 |
|
5 |
Lack of downtown identity/feel |
22.90 |
83 |
|
6 |
Lack of nearby shopping options |
21.80 |
79 |
|
7 |
Lack of safe non-motorized transport (bike) |
16.80 |
61 |
|
8 |
High local taxes (school) |
16.30 |
59 |
|
9 |
No municipal water supply |
15.40 |
56 |
|
10 |
Other |
14.00 |
51 |
|
11 |
lack of park and recreation options |
8.00 |
29 |
|
12 |
Lack of cultural opportunities |
7.70 |
28 |
|
13 |
Traffic congeston |
7.70 |
28 |
|
14 |
Lack of public transportation |
6.90 |
25 |
|
15 |
Whitmore lake schools |
5.80 |
21 |
|
16 |
High cost of living |
5.50 |
20 |
|
17 |
Lack of proximity to my employment |
3.30 |
12 |
|
18 |
Too much commercial development |
1.90 |
7 |
|
19 |
Lack of affordable homes |
1.90 |
7 |
|
20 |
Limited housing options |
1.90 |
7 |
|
21 |
Public safety |
1.90 |
7 |
|
22 |
Proximity fo Dexter |
1.70 |
6 |
|
23 |
Access to top tier schools |
1.40 |
5 |
|
24 |
Close to highways |
1.40 |
5 |
|
25 |
Proximity to A2 |
0.80 |
3 |
|
26 |
Rural character |
0.60 |
2 |
|
Ann arbor schools |
0.30 |
1 |
|
|
Dexter schools |
0.00 |
0 |
|
|
South Lyon schools |
0.00 |
0 |
|

